JupyterHub usage#
This displays the usage of our cloud infrastructure to give an understanding of our infrastructure setup and the communities that use it.
Last updated: Jul 05, 2025
Data source
This data is pulled from these two sources:
The list of our hubs and clusters is pulled from our
infrastructure/repository.The active users data stream produced by JupyterHub and exposed at
metrics/. See this PR for the feature.
Load and munge data#
Number of hubs#
29
127
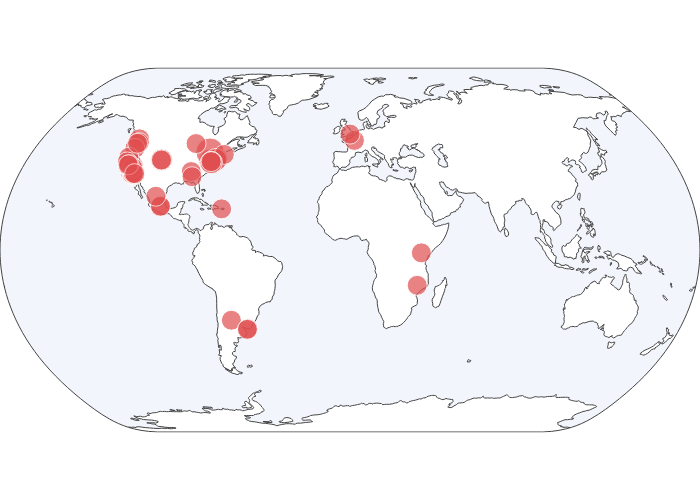
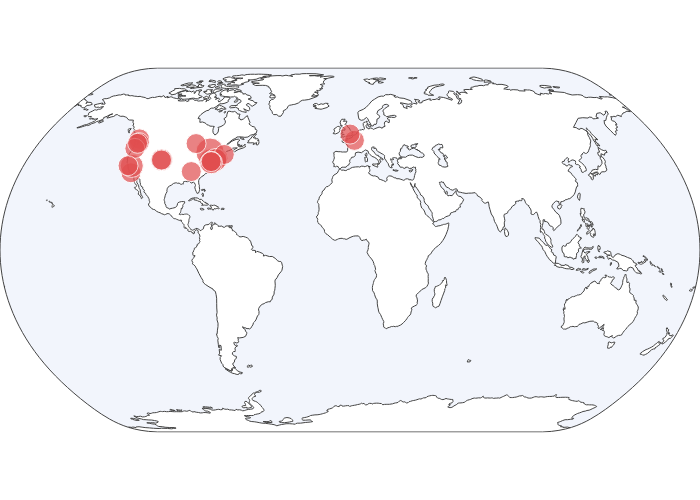
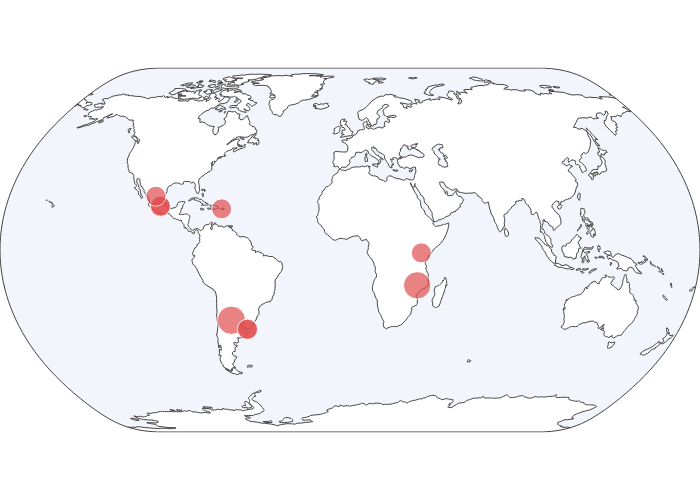
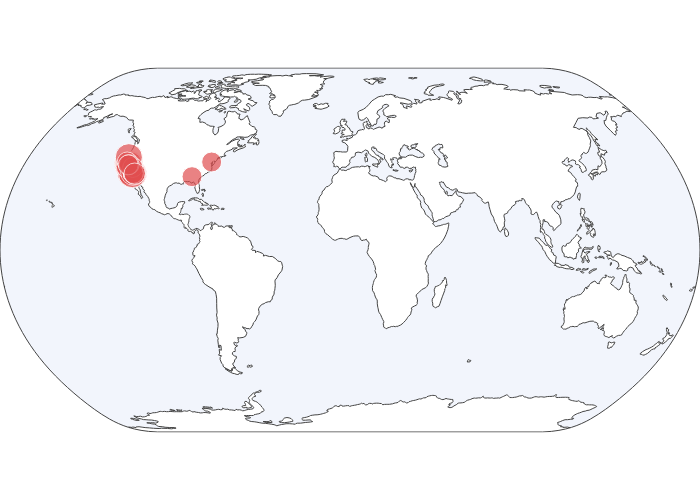
Geographic map of community locations#
Below is a visualization that represents the hubs
Below is a dropdown with a few PNGs of different hub constellations for re-use.
Show code cell outputs
All 2i2c hubs
Permanent link: 2i2c.org/kpis_static/maps/2i2c_hubs_map.png

Constellation: 2i2c
Permanent link: 2i2c.org/kpis_static/maps/2i2c_map.png

Constellation: Catalyst
Permanent link: 2i2c.org/kpis_static/maps/Catalyst_map.png

Constellation: CloudBank
Permanent link: 2i2c.org/kpis_static/maps/CloudBank_map.png

Active users#
Average active users over the past 6 months.
1183
7505
Monthly active users over the past 6 months
Active users by hub#
Active users broken down by each hub that we run. We break our hubs into two groups as some hubs have orders of magnitude more users than others.
Count hubs by community size#
Total number of users binned by community size#
Tells us the percentage of our userbase that comes from different community sizes.
